Open topic with navigation
Step 4: Start the Scan
In this step, you will configure a strip chart for viewing results and then run the scan.
You can display the instrument's scan data, during a scan, in several different graphical formats using display gadgets within the Graphics Setup tab, located to the right of the Configure Channels tab. Each gadget displays the scan data in an independent window, which you can customize and position within the Graphics Setup tab. Let's take a look at the scan data in graph form using the Strip Chart gadget.
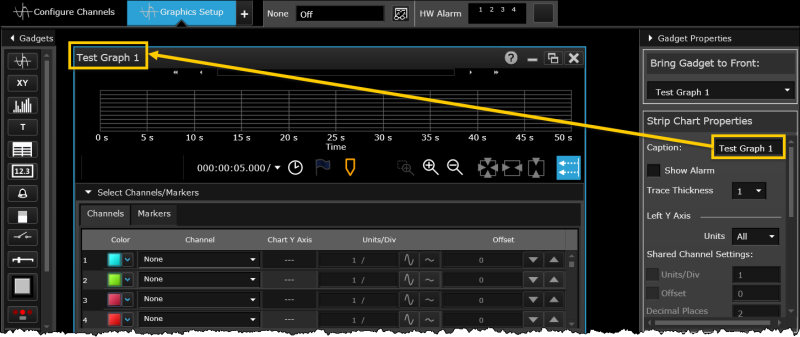
- From the Graphics Setup tab, click on the Strip Chart
 button to open a Strip Chart gadget window.
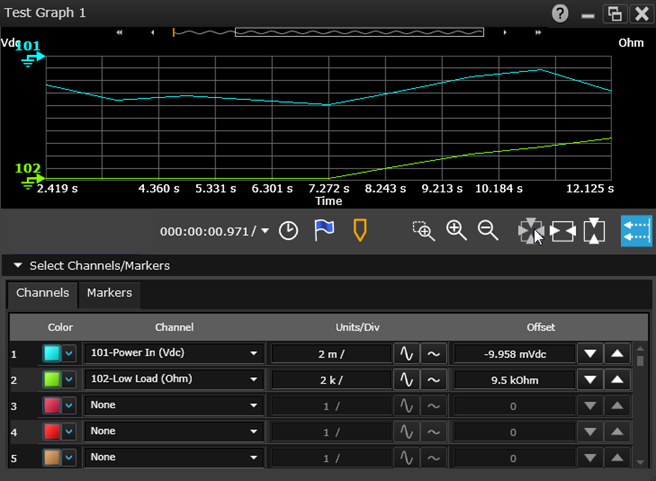
- First, let's change the caption at the top of the Strip Chart gadget window. From the Properties pane on the right side of the Graphics Setup tab, change the caption from its default of "Strip Chart" to "Test Graph 1".
Note: To adjust the size of a gadget window, drag the bottom right corner of the window.
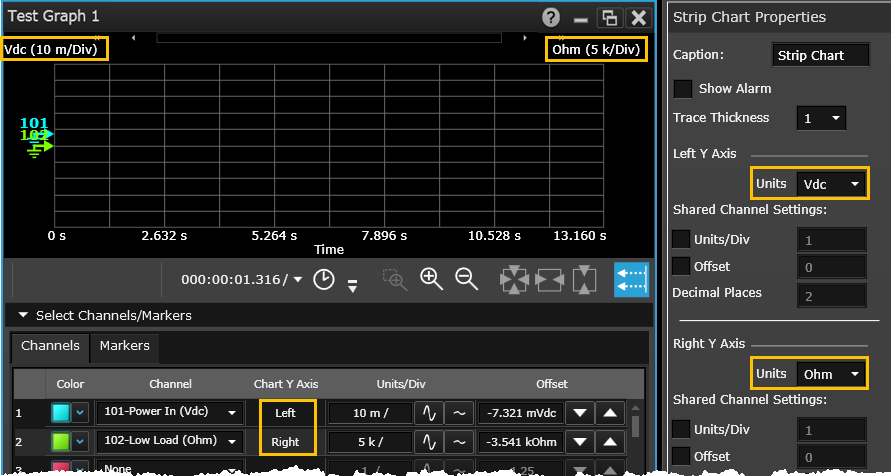
- Next you need to define the unit labels for the graph's Y Axis. Note that you can define a different label for the left and right side of the graph, but they cannot be the same units. For this example, set the left unit label to "Vdc" and the right unit label to "Ohm".
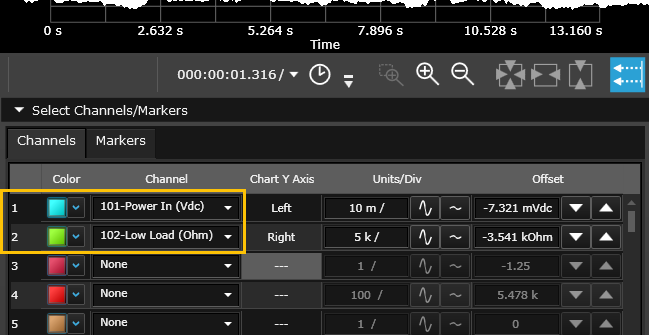
- By default, the lowest-numbered channel in the current scan list is added as a trace to the strip chart. To add channels, go to the Select Channels/Markers drop-down at the bottom of the window, click on the Channels tab, and then assign the desired channels. For this step, assign channel 101 to the cyan trace and channel 102 to the green trace by clicking the associated drop-down in the "Channels" column.
-
To start the scan, click the Start  button in the lower left corner of the DAQ application window. Once you have started the scan, the settings you configured in Data Logging Settings become enabled. For this tutorial, scanning was set to start "Immediately with Start Button" and the scan will start when you click the Start button (if connected to an actual instrument on your bench, you should hear multiplexer relays closing/opening).
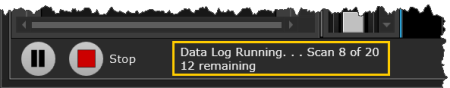
Note that once scanning begins, the Start button turns into a Stop  button. You can stop a running scan at any time by clicking the Stop button.
- The corresponding traces are plotted on the strip chart as shown below.
-
The current status of the scan (in below example, 8 of the 20 scans remain) is shown on the settings and controls panel as highlighted in yellow box.